
The year 2025 is in the books. As I’ve done in the past years, this is my annual review post for the year. How did my stock portfolio do in 2025? And more importantly, how it affected my ten-year performance, which is where I tend to focus. Note that the following analysis relates to just my stock holdings, and not any other asset class (cash and cash substitutes and direct real estate). Stocks are where majority of my net worth is invested in.
One-Year Performance: Looking at the raw numbers, it was a good year for me. I finished up 12.5% TWR (Time Weighted Return). But if we were grading on a curve, I got left in the dust by both the S&P 500 and the NASDAQ composite. The S&P surged by 16% and NASDAQ by an even higher 20%.
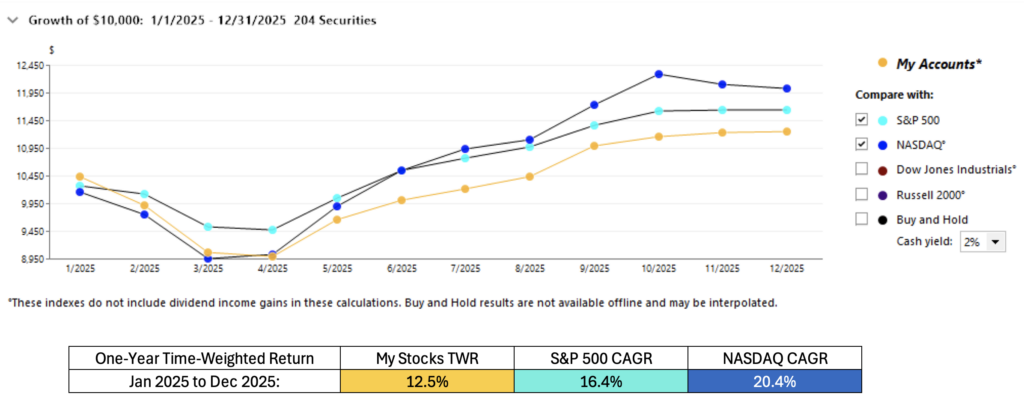
My portfolio return is time-weighted, meaning that it didn’t take into account any cash transfers in and out of the portfolio (like when I brought in cash from my dry powder bucket to buy stocks in April, or when I sold some stocks in the 4th quarter to raise cash again). Both S&P and NASDAQ returns are from price indexes that do not consider dividends. S&P 500 total return (that assumes reinvested dividends) was about 2% higher. I don’t reinvest any dividends in my portfolio.
So what held my portfolio back last year? See this bubble chart.
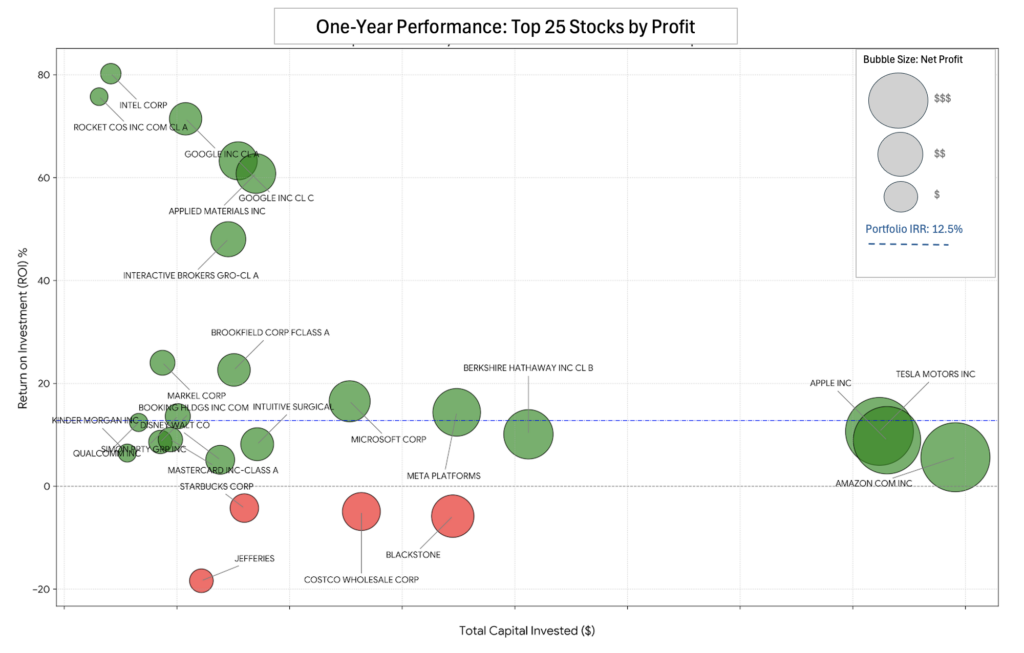
My “Big Three”, Amazon, Apple, and Tesla, that make up nearly a third of my portfolio performed below average last year. Amazon only gave me 5.7% and Apple posted a modest 8.6%. With Tesla at 11.4%, these three heavyweights performed at half the speed of the market.
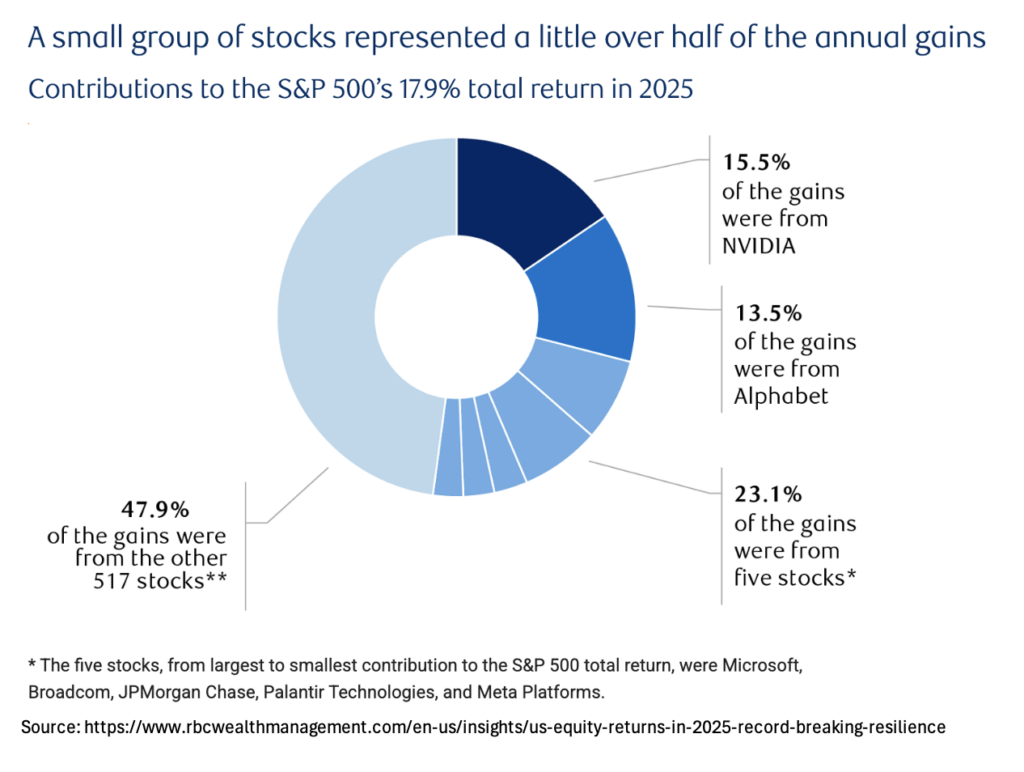
In 2025, the market fell in love with the new plumbing of AI. Companies like NVIDIA, Broadcom, Palantir, Micron, and Western Digital were the year’s superstars. Seven stocks contributed just over half of the S&P 500’s gains last year. See this graphics.
I own only a few of the AI related names. Among them Alphabet/Google (+70%) and Applied Materials (+63%) did some heavy lifting for me. Microsoft and Meta also contributed nicely. Pulling the other way were some other names like Blackstone, Costco, Starbucks, and Jefferies. Though they didn’t do well last year, they are all good businesses that I plan to hold on to.
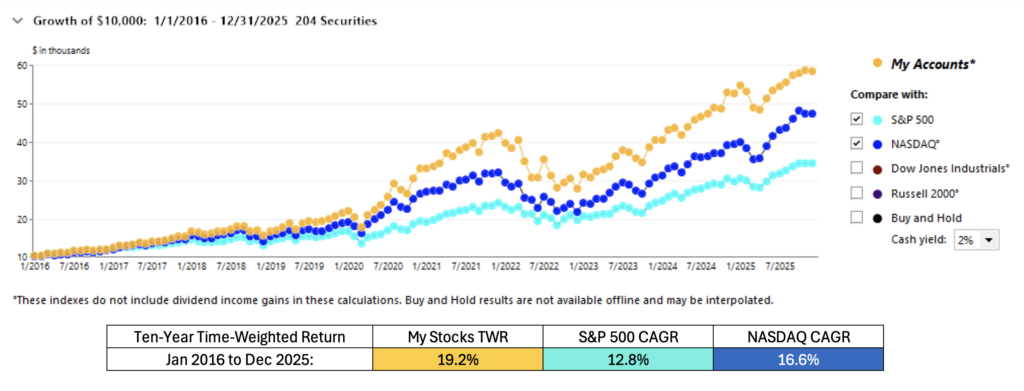
One year is just a blip, five years make a trend, but it is the ten-year performance that really counts for long-term investors like me. Below you will see my 5– and 10–year charts.
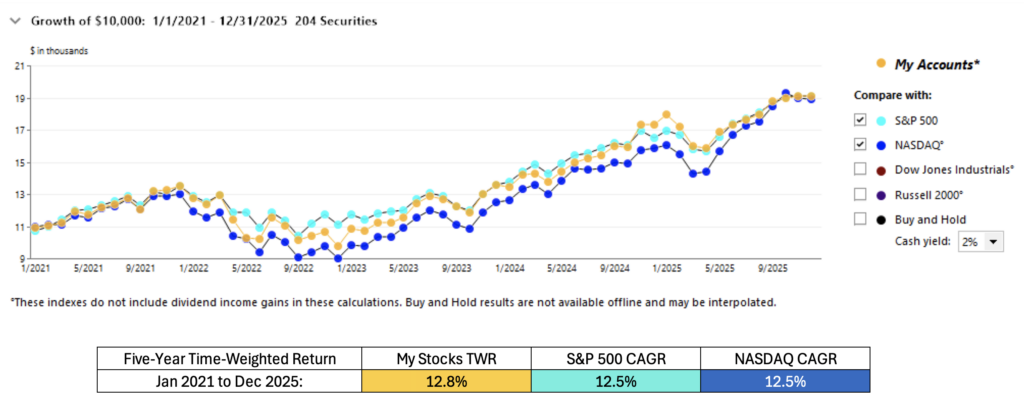
My 5-year TWR dropped a bit due to last year’s underperformance but still managed to edge out the market. You can see from the chart how NASDAQ’s steep rise in the second half of 2025 was not matched by either my portfolio or the S&P 500 index.
Ten-Year Performance: From 2016 through 2025, my portfolio clocked an annualized return (TWR) of 19.2%, leaving both the S&P 500 (12.8%) and the tech-heavy NASDAQ (16.6%) in the rearview mirror.
It is a bit crazy to consider that my portfolio has beaten the NASDAQ Composite’s ten-year performance by nearly 3 percent without owning a single share of NVIDIA. After all, NVIDIA returned at 74% CAGR in the same period – that is over 262 times the initial price. Needless to say, there were other excellent long-term compounding businesses out there. I owned three of those during the entire period: Tesla, Apple, and Amazon. See this bubble chart.
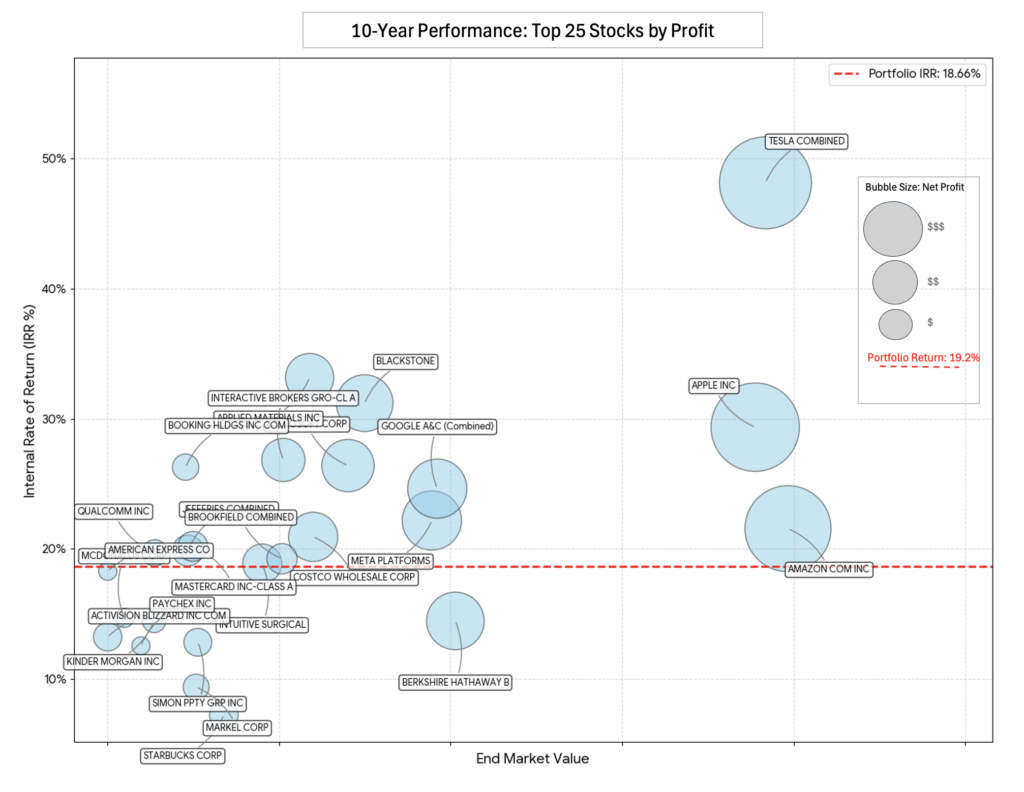
Those three names alone generated nearly 40% of the portfolio’s total profits, proving that one does not need to own every single winner to outperform the market. As a result, today, the three names make up roughly 36% of my total invested capital. I let my winners run.
Other notable tech companies that helped my portfolio pull ahead were Alphabet, Meta, Microsoft, and Applied Materials. But it wasn’t all technology. Blackstone, Costco, Interactive Brokers, and Brookfield among others were some of the non-tech businesses that did very well for my portfolio, as can be seen from the table below.
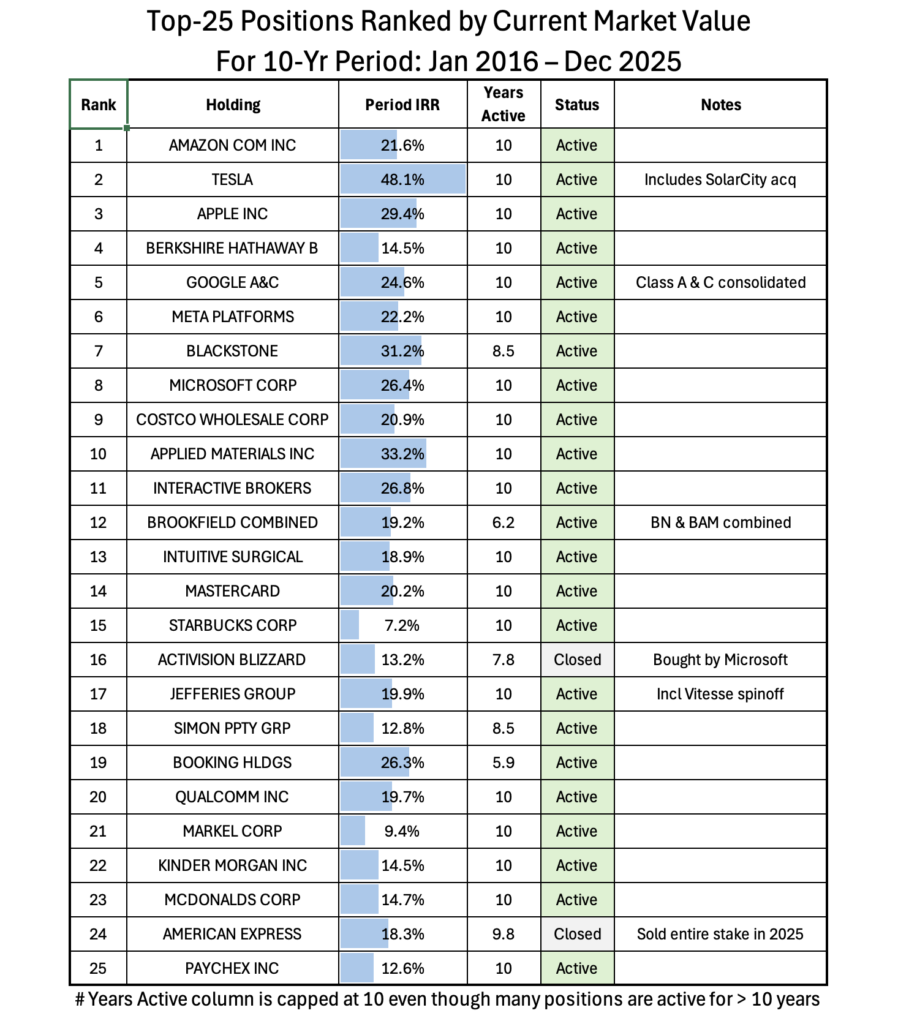
Last but not the least, while Berkshire Hathaway did about the same as the market overall, I consider it a key part of my portfolio (4th largest position). It functions as a ballast when there is turmoil in the markets; we’ve gone through a few of those in the previous decade (e.g. Covid shutdown, 2022 inflation, etc.)
And finally, even though not shown in the graphics, there were a few loss makers too, such as IPG Photonics and United Health but their impact was small. My worst loss was a fraction of a percent of the total capital while my winners were “home runs”. This asymmetry—uncapped upside with managed downside—is what creates generational wealth.
It’s been a wild, volatile ride, but the last decade proved one thing: patience and conviction pay better than any trading algorithm ever could. Here’s to the next ten!
Leave a Reply